|
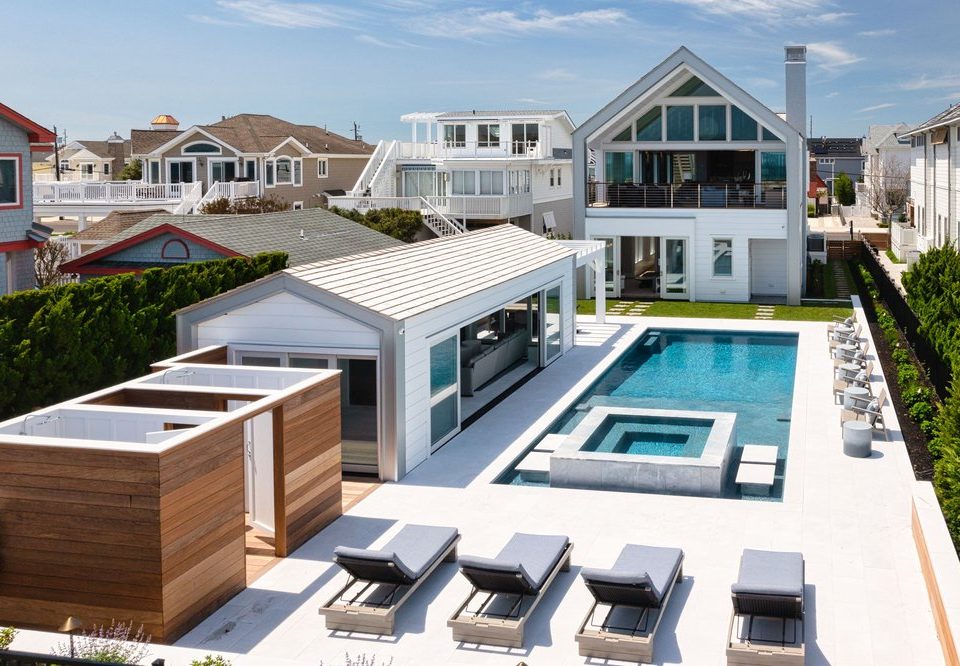
SEA BRIGHT MONTHLY REAL ESTATE REPORT |
|
|
June 1 – June 30, 2013 |
|
|
Total Number of closed sales |
0 |
|
Average days on market |
0 |
|
Ratio of sale price to list price |
0% |
|
Lowest closed price |
$0 |
|
Highest closed price |
$0 |
|
Median closed price |
$0 |
|
Distribution of Closed Sales |
|
|
# under $400,000 |
0 |
|
# between $400,001-$700,000 |
0 |
|
# above $700,001 |
0 |
|
Total under contract as of 7/3/13 |
1 |
|
Total homes available as of 7/3/13 |
7 |
|
Median price of available homes |
$1,295,000 |
|
|
|
|
Source: Monmouth/Ocean MLS. Information deemed reliable but not guaranteed. |
|
If you have any questions about the numbers, or if you’d like to talk to me about buying or selling
Sea Bright real estate, please text me or give me a call 732.245.4031.


